
“If you can’t measure it, you can’t manage itâ€
That quote has been attributed to many individuals, the most famous being those icons of modern management philosophy Peter Drucker and Edward Deming. I would hazard a guess that all successful business men and women have paid attention to that quote and made sure they measured as many components of their companies as possible!
Balance sheets, income statements, and productivity statistics can all be relatively easy to measure and then manage to industry benchmarks. But one of the most difficult areas in a company to quantify can be customer satisfaction and loyalty. Yet customer satisfaction and loyalty can lead to repeat business, easier sales, more new customers, additional revenue, and higher profits! The questions have always been: How do you measure it? What metric(s) do you use? How do you manage it? How do you make sure the numbers you are reporting are unbiased?
Most of our competitors, if not all of them, claim that they have the “best service in the businessâ€, but few have a way to really measure the satisfaction and loyalty of their customers. They, like we used to, use internal productivity measures to tout how well they are doing thus making an assumption that their achievement of that metric is resulting in customer satisfaction and loyalty. Many times that assumption can be erroneous as there may not be a direct correlation of the metric’s achievement with satisfaction. As an example, I visited an account in which our excellent service statistics should have netted a high satisfaction quotient for us. However, when presented with the statistics, our customer stated that while they liked the service we provided they would be more satisfied if the technician would let them know when he was arriving, when the equipment was fixed and the cause of the problem.
In our search for a way to measure our customers’ satisfaction and loyalty a trusted vendor brought the Net Promoter Score system to us. We found out the Net Promoter Score system is the gold standard for companies who want to translate customer experience into profitable growth. It allows us to capture feedback after every service call and is a straight forward loyalty metric that holds Thermocopy and our employees accountable for how we treat customers. It is also a discipline for using customer feedback to fuel profitable growth in our business. It has gained popularity thanks to its simplicity and its linkage to profitable growth. Employees at all levels of the organization understand it, opening the door to customer-centric change and improved business performance. Thermocopy started to use this measurement of customer satisfaction and loyalty in January of 2014.
The process is simple. An email containing a survey is automatically generated and sent to the client by our ERP system after every service visit. We have no control over this process. All survey responses, the good, the bad, and the ugly, are sent directly from the client to Satmetrix (the developer of the NPS system) to score thus ensuring a true third-party certification process. We also receive a copy of the response. Since January 1, 2014 there has been a 14% response rate to the emailed surveys.
Our Net Promoter Score for the month of January, 2014 was 85.14 and we were ranked 83rd of the 108 companies in our industry utilizing the measurement at that time. We decided the score and ranking was abysmal and made the determination to do better. Since we had a measurement, we put in place processes to manage the results. We review the surveys in company meetings on a weekly and monthly basis and the Net Promoter Score is published on our web site. The surveys are also part of the individual team member’s monthly review process. What has been really phenomenal is that we all now have a way of knowing what our customers think is important when engaging them rather than what we think is important. As a result we have improved our Y-T-D 2015 Net Promoter Score to 94.14 and a ranking of 20 out of the 202 companies reporting for our industry. While that is significant improvement we are not finished with our journey to better customer satisfaction.
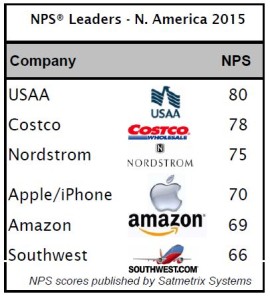
I find it very interesting that the average Net Promoter Score for North American companies is 10. Listed below are the Y-T-D 2015 Net Promoter Scores for leading companies in North America.
Visit http://www.thermocopy.com/our-company/net-promoter-score/ for the most up-to-date results of our journey to 100% customer satisfaction and loyalty.
 If you would like more detailed information about the Net Promoter Score visit http://www.satmetrix.com/nps-score-model/.
Measure and manage your customer satisfaction and loyalty!
“If you can’t measure it, you can’t manage itâ€
That quote has been attributed to many individuals, the most famous being those icons of modern management philosophy Peter Drucker and Edward Deming. I would hazard a guess that all successful business men and women have paid attention to that quote and made sure they measured as many components of their companies as possible!
Balance sheets, income statements, and productivity statistics can all be relatively easy to measure and then manage to industry benchmarks. But one of the most difficult areas in a company to quantify can be customer satisfaction and loyalty. Yet customer satisfaction and loyalty can lead to repeat business, easier sales, more new customers, additional revenue, and higher profits! The questions have always been: How do you measure it? What metric(s) do you use? How do you manage it? How do you make sure the numbers you are reporting are unbiased?
Most of our competitors, if not all of them, claim that they have the “best service in the businessâ€, but few have a way to really measure the satisfaction and loyalty of their customers. They, like we used to, use internal productivity measures to tout how well they are doing thus making an assumption that their achievement of that metric is resulting in customer satisfaction and loyalty. Many times that assumption can be erroneous as there may not be a direct correlation of the metric’s achievement with satisfaction. As an example, I visited an account in which our excellent service statistics should have netted a high satisfaction quotient for us. However, when presented with the statistics, our customer stated that while they liked the service we provided they would be more satisfied if the technician would let them know when he was arriving, when the equipment was fixed and the cause of the problem.
In our search for a way to measure our customers’ satisfaction and loyalty a trusted vendor brought the Net Promoter Score system to us. We found out the Net Promoter Score system is the gold standard for companies who want to translate customer experience into profitable growth. It allows us to capture feedback after every service call and is a straight forward loyalty metric that holds Thermocopy and our employees accountable for how we treat customers. It is also a discipline for using customer feedback to fuel profitable growth in our business. It has gained popularity thanks to its simplicity and its linkage to profitable growth. Employees at all levels of the organization understand it, opening the door to customer-centric change and improved business performance. Thermocopy started to use this measurement of customer satisfaction and loyalty in January of 2014.
The process is simple. An email containing a survey is automatically generated and sent to the client by our ERP system after every service visit. We have no control over this process. All survey responses, the good, the bad, and the ugly, are sent directly from the client to Satmetrix (the developer of the NPS system) to score thus ensuring a true third-party certification process. We also receive a copy of the response. Since January 1, 2014 there has been a 14% response rate to the emailed surveys.
Our Net Promoter Score for the month of January, 2014 was 85.14 and we were ranked 83rd of the 108 companies in our industry utilizing the measurement at that time. We decided the score and ranking was abysmal and made the determination to do better. Since we had a measurement, we put in place processes to manage the results. We review the surveys in company meetings on a weekly and monthly basis and the Net Promoter Score is published on our web site. The surveys are also part of the individual team member’s monthly review process. What has been really phenomenal is that we all now have a way of knowing what our customers think is important when engaging them rather than what we think is important. As a result we have improved our Y-T-D 2015 Net Promoter Score to 94.14 and a ranking of 20 out of the 202 companies reporting for our industry. While that is significant improvement we are not finished with our journey to better customer satisfaction.
I find it very interesting that the average Net Promoter Score for North American companies is 10. Listed below are the Y-T-D 2015 Net Promoter Scores for leading companies in North America.
Visit http://www.thermocopy.com/our-company/net-promoter-score/ for the most up-to-date results of our journey to 100% customer satisfaction and loyalty.
 If you would like more detailed information about the Net Promoter Score visit http://www.satmetrix.com/nps-score-model/.